
The value of your IT system is never known until its not working.
With so many monitoring options for logging, metrics and alerts its easy to understand that companies put this in the backlog, sometimes until it’s too late. Without a unified way of monitoring your IT systems you can be in the dark and attributing blame in wrong areas. When things go wrong and your monitoring solution is not giving you the information you need you are losing money in terms time spent fixing the problem and loss of up time of your services to customers. A good centralised monitoring solution adds value in the long run to your organisation.
So how where do you start if you don’t have a centralised monitoring solution?
The first step is to determine what level of monitoring your business needs. The bare minimum is saving and retaining logs in a centralised location for auditing purposes. This solution will suffice in some aspects of compliance, but fails to give you the value creating benefits mentioned earlier. For most monitoring projects it is worth considering whether the environment is well understood and documented; understand what data and the amount your monitoring system will need to ingest; and whether you should use an off-the shelf, commercial or outsourced monitoring tools.
When it comes to data, logs can be broken down in the following categories:
- Firewall and Switch logs
- Windows Event Logs
- SQL Server Logs
- Web Server Logs
- Operating System Logs
- Application Logs
It is worth considering the metrics that your organisation finds valuable, some important IT system metrics can include the following:
- Uptime of services
- Performance of services – page load speed
- CPU utilisation
- Memory utilisation
- Disk Capacity metrics
- I/O metrics
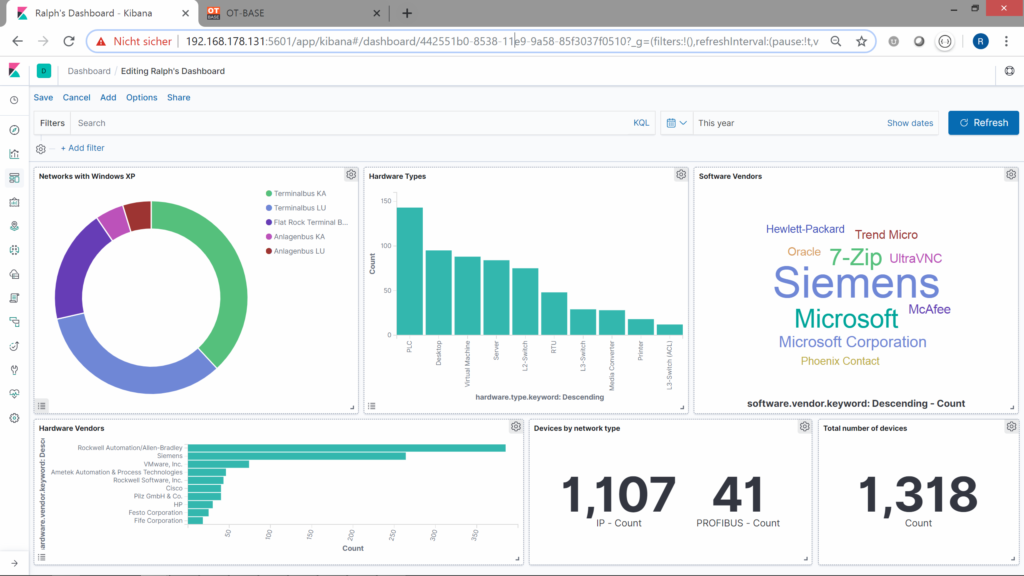
When these logs and metrics are combined and analysed with the appropriate visualisations you can get a good picture into your IT environments.
So how do you pick the right solution?
It is worth considering what requirements you have for your solution; your circumstances may vary, but the main functional components of the solution can include:
- Collecting and Ingest logs using agents and log parsers
- Parsing/Filtering/Enriching
- Transport of Logs and Metrics
- Encryption – both in transit and at rest
- Store
- Scalability
- Reporting and visualisations
- Alerting to Microsoft Teams, Slack or Email
Choosing a monitoring platform from the list of competitors can be daunting, but there are several good options that can be both free or paid – your team might have a preference towards some of these given their experience. At the time of writing this blog the main choices are
- Elasticsearch
- Datadog
- Zabbix
- Splunk
- LogRhythm
- Cloud Native – Azure Monitor, AWS Cloudwatch, GCP Stackdriver
After you have evaluated the monitoring platform you will need to determine whether you will build and house your own monitoring platform components or use a paid service. Building your own will require your team to understand how to purchase, configure and maintain on-premise or cloud-based monitoring services. Your team will need training for this option but may better suit your requirements. Paid for monitoring services offer faster deployment times, scalability with the amount of data but may be limited in terms of specific functionality.
Working through these considerations for your next monitoring platform will save your company and prevent your team making the wrong decisions. Ultimately your organisation will benefit from monitoring and alerting by allowing your team IT or security team to identify issues and act.
If you would like more information about monitoring please feel free to reach out.